UK DIY News
B&M: 'Resilient Profit Delivery And Continued Growth Despite Headwinds'

B&M European Value Retail S.A. ("the Group"), a leading European variety goods value retailer, today announces its Preliminary Results for the 52 week financial reporting period to 29 March 2025 ("FY25"). The comparative reporting period is for the 53 week financial reporting period to 30 March 2024 ("FY24").
Headline measures (on a comparable basis) | FY25 (52 weeks) | FY24 (52 weeks) | Change |
Group revenue | £5,571m | £5,372m | 3.7% |
Group adjusted EBITDA (pre-IFRS 16)1 | £620m | £616m | 0.6% |
Group adjusted operating profit1 | £591m | £602m | (1.8)% |
Adjusted diluted EPS | 33.5p | 35.9p | (6.7)% |
Group post-tax free cash flow2 | £311m | £382m* | (18.5)% |
Ordinary dividends3 | 15.0p | 14.7p* | 2.0% |
Net debt4 | £781m | £737m* | 5.9% |
|
|
|
|
Statutory measures (on a full financial year basis) | FY25 (52 weeks) | FY24 (53 weeks) | Change |
Total Group revenue | £5,571m | £5,484m | 1.6% |
Group operating profit | £566m | £608m | (7.0)% |
Group profit before tax | £431m | £498m | (13.2)% |
Statutory diluted EPS | 31.8p | 36.5p | (13.0)% |
Group cash generated from operations | £784m | £862m | (9.1)% |
*as reported last year on a 53-week basis |
|
|
|
|
|
|
|
Key highlights (on a 52-week comparable basis) |
|
|
|
- Group revenues increased by 3.7% to £5.6bn (+4.0% constant currency5) primarily driven by the contribution from new stores
- Group adjusted EBITDA (pre-IFRS 16)1 of £620m (FY24: £616m) is in the upper half of the guided range from February 2025, and is 0.6% higher than the previous year
- Group adjusted operating profit1 of £591m (FY24: £602m) decreased 1.8%, due to higher depreciation from our asset base
- Robust Group gross margin performance underpinned by an increase in B&M UK's trading margin6 which rose by 42 bps to 36.7% due to increased General Merchandise sales participation and clean sell-through during the year
- Operating profit of £566m (FY24 53 weeks: £608m) decreased due to higher depreciation and adjusting items, with profit before tax of £431m (FY24 53 weeks: £498m) impacted by increased interest and finance costs
- Adjusted diluted earnings per share1 of 33.5p (FY24: 35.9p) and statutory diluted earnings per share of 31.8p (FY24 53 weeks: 36.5p)
- Post-tax free cash flow2 of £311m (FY24 53 weeks: £382m), principally with a year-on-year working capital outflow from increased stock holding leading to lower free cash generation
- Net debt4 to adjusted EBITDA (pre-IFRS 16)1 leverage ratio4 of 1.26x (FY24: 1.17x). Net debt including leases4 to adjusted EBITDA (post-IFRS 16)1 2.56x (FY24: 2.40x)
- Recommended final dividend3 of 9.7p per ordinary share, bringing the full year dividend to 15.0p per share (2024: 14.7p) in addition to the 15.0p special dividend paid in February 2025 (FY24: 20.0p)
- Group adjusted return on capital employed (ROCE)7 of 30.4% demonstrates continued efficient use of capital. £2.1bn returned to shareholders over the last five years.
- Opened 70 gross new stores across the Group (45 in B&M UK, 14 in Heron Foods and 11 in B&M France). Pipeline well-set for next year
- New UK import centre set to be operational this summer and the distribution centre expansion project in France is progressing well
- Redomicile process, which will simplify administrative processes and enable greater flexibility in returning capital to shareholders, including through share buybacks, is progressing to plan. Process now focused upon redomicile to Jersey and expected to complete within the calendar year, subject to the necessary regulatory and legal clearances
- As announced on 15 May 2025, Tjeerd Jegen will join as CEO on 16 June 2025
Fascia performance8 | Revenue growth % | Adjusted EBITDA (pre-IFRS 16)1 margin % | Adjusted operating profit1 margin % | |||
FY25 | FY24 | FY25 | FY24 | FY25 | FY24 | |
B&M UK | 3.8% | 6.2% |
12.2% |
12.6% |
11.8% |
12.4% |
B&M France | 7.8% | 16.7% |
8.8% |
9.1% |
8.9% |
9.5% |
Heron Foods | (0.6)% | 13.1% |
5.5% |
6.4% |
3.0% |
4.9% |
Notes:
1. Adjusted values are considered to be appropriate to exclude unusual, non-trading and/or non-recurring impacts on performance which therefore provides the user of the accounts with additional metrics to compare periods of account. See Notes 2, 3 and 4 of the financial statements for further details.
2. Post-tax free cash flow is an Alternative Performance Measure. Please see Note 3 of the financial statements for more details and reconciliation to the consolidated statement of cash flows. Statutory Group cash generated from operations was £784m (FY24: £862m). This statutory definition excludes payments for leased assets including the leasehold property estate.
3. Dividends are stated as gross amounts before deduction of Luxembourg withholding tax which is currently 15%.
4. Leverage ratio (pre and post-IFRS 16) is calculated as net debt divided by adjusted EBITDA. See Note 28 of the financial statements for definition and net debt (pre and post-IFRS 16) reconciliation. This is a measure of the Group's ability to meet its payment obligations and is widely used by analysts and credit rating agencies.
5. Constant currency comparison involves restating the prior year Euro revenues using the same exchange rate as that used to translate the current year Euro revenues.
6. Trading gross margin is considered to be a meaningful measure of profitability as it refers to the measure of gross margin used by management to commercially run the business. It differs to the statutory definition for B&M UK, which increased 47 bps from 36.9% to 37.4%, due to technical accounting adjustments in relation to the allocation of gains and losses from derivative accounting, storage costs and commercial income.
7. Adjusted return on capital employed (ROCE), is defined as adjusted operating profit (£591m) divided by the closing carrying value of property, plant & equipment (£448m), right-of-use assets (£1,159m) and software (£5m) plus net working capital (£334m). This metric represents the profit generated as a proportion of the total assets that the business has utilised in the period. Management believes that this is a useful measure to assess performance.
8. References in this announcement to the B&M UK business include the B&M fascia stores in the UK except for the 'B&M Express' fascia stores. References in this announcement to the Heron Foods business include both the Heron Foods fascia and B&M Express fascia convenience stores in the UK.
Supplemental information
We report sales on a 13-week and 52-week retail calendar - which uses 364 days in a year. A 53rd week was added to our reporting calendar in FY24. The additional week only affects comparability of performance in our statutory reporting.
To aid comparability for the user, throughout these results we have compared performance in FY25 against performance in FY24 on a 52-week basis by removing the 53rd week (week ending 30 March 2024) from the prior period's statutory result.
Source : B&M
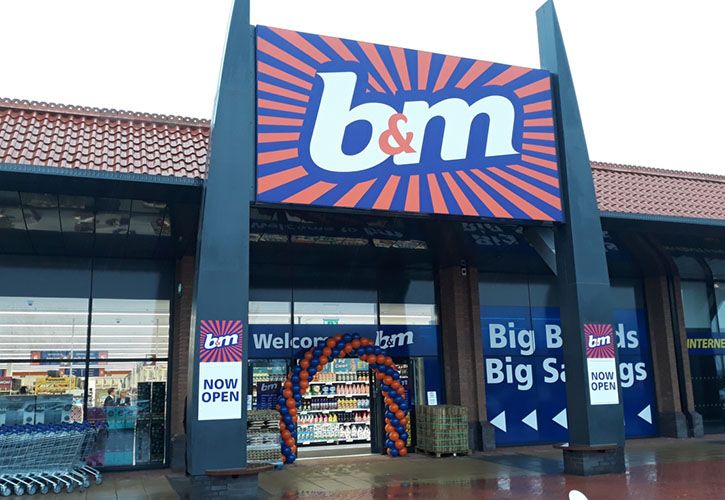
Image : B&M
Insight provides a host of information I need on many of our company’s largest customers. I use this information regularly with my team, both at a local level as well as with our other international operations. It’s extremely useful when sharing market intelligence information with our corporate office.


